
Elections to 11 local councils took place in Northern Ireland on Thursday 2 May 2019. Parties fielded 819 candidates in all. Since the previous local elections in 2014, public debates had raged over social issues such as marriage equality and abortion rights. Women’s empowerment was a regular theme that focused on the relative absence of women in political, economic and social decision-making. In this election, women comprised just 27.5% of candidates (Table 1).
Table 1: Candidates by party, 2019 (Number, %)
| PARTIES | Male | Female | Total | % Female |
| DUP | 133 | 38 | 171 | 22.2 |
| SF | 97 | 59 | 156 | 37.8 |
| UUP | 99 | 18 | 117 | 15.4 |
| SDLP | 55 | 30 | 85 | 35.3 |
| APNI | 53 | 30 | 83 | 36.1 |
| Green | 15 | 11 | 26 | 42.3 |
| TUV | 27 | 5 | 32 | 15.6 |
| Independents/Other | 115 | 34 | 149 | 22.8 |
| TOTAL | 594 | 225 | 819 | 27.5 |
As in previous elections, the more gender-balanced candidate slates came from nationalist parties (SF, Social Democratic and Labour Party – SDLP), the centre Alliance Party (APNI), and the constitutionally unaligned Green Party (Table 1). Unionist parties – the Ulster Unionist Party (UUP), DUP and Traditional Unionist Voice (TUV), continued to put forward male-dominated tickets.
Since 1997, women’s total share of candidacies has grown modestly [1] (Table 2 – figures rounded up). This aggregated total hides considerable variation among parties over time: SF and the Green Party have more than doubled their proportion of female candidates over this 22-year period. The UUP and DUP have only modestly increased female candidacies in this time.
Table 2: Female candidates by party 1997-2019 (%)
| 1997 | 2001 | 2005 | 2011 | 2014 | 2019 | |
| DUP | 16 | 14 | 21 | 24 | 27 | 22 |
| SF | 16 | 19 | 28 | 29 | 32 | 38 |
| UUP | 12 | 17 | 11 | 21 | 15 | 15 |
| SDLP | 22 | 27 | 29 | 27 | 33 | 35 |
| APNI | 33 | 35 | 31 | 32 | 30 | 36 |
| Green | 20 | 0 | 13 | 27 | 29 | 42 |
| TUV | 0 | 0 | 0 | 13 | 10 | 16 |
| TOTAL | 16 | 19 | 21 | 24 | 24 | 28 |
Some local council ballot papers offered voters a more gender-diverse choice than others (Table 3). In Belfast City Council, over one-third (35%) of the candidates were female. L’Derry and Strabane Council (33%) and Fermanagh and Omagh District Council (32%) also presented a ‘critical mass’ of female candidates to the electorate.
Table 3: Candidates in 2019 Local Elections, (Number, %)
| COUNCILS | Male | Female | Total | %Female |
| Antrim, Newt’nabbey | 51 | 14 | 65 | 21.5 |
| Ards, North Down | 53 | 15 | 68 | 22.1 |
| Armagh City, Banbridge, Craigavon | 59 | 13 | 72 | 18.1 |
| Belfast City | 84 | 45 | 129 | 34.9 |
| Causeway Coast, Glens | 51 | 20 | 71 | 28.2 |
| L’Derry, Strabane | 50 | 25 | 75 | 33.3 |
| Fermanagh, Omagh | 51 | 24 | 75 | 32.0 |
| Lisburn, Castlereagh | 51 | 16 | 67 | 23.9 |
| Mid, East Antrim | 51 | 17 | 68 | 25.0 |
| Mid Ulster | 42 | 16 | 58 | 27.6 |
| Newry, Mourne, Down | 51 | 20 | 71 | 28.2 |
| TOTAL | 594 | 225 | 819 | 27.5 |
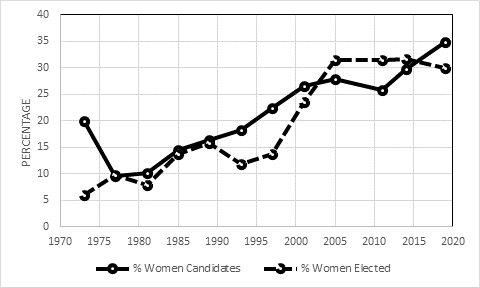
As an urban area, Belfast city has consistently led the way in providing political opportunities for women (Figure 1).
Figure 1: Belfast City Council elections 1973-2019
Derry and Strabane Council, along with the Fermanagh and Omagh Council are strongly nationalist in orientation, returning 22 of 40 seats to Sinn Fein and the SDLP in the case of L’Derry and Strabane, and 20 of 40 seats to these parties in Fermanagh and Omagh. As Table 1 shows, these parties are more open to selecting female candidates than their unionist counterparts.
This point brings us to examining the electoral outcomes in 2019 (Table 4).
Table 4: Councillors by party, 2019 (Number, %)
| PARTIES | Male | Female | Total | % Female |
| DUP | 99 | 23 | 122 | 18.9 |
| SF | 68 | 37 | 105 | 35.2 |
| UUP | 61 | 14 | 75 | 18.7 |
| SDLP | 38 | 21 | 59 | 35.6 |
| APNI | 32 | 21 | 53 | 39.6 |
| Green | 6 | 2 | 8 | 25.0 |
| TUV | 6 | 0 | 6 | 0.0 |
| Independents/Other | 30 | 4 | 34 | 11.8 |
| TOTAL | 340 | 122 | 462 | 26.4 |
The first point to note is that the proportion of women elected (26%) is slightly below the proportion of women candidates (28%). This outcome is lower than the average share of council seats held by women in England (34%), and across Europe (33%).[2]
Sinn Fein returned by far the most women councillors, 37 (Table 5). The Alliance party had the highest proportion of women returned to councils, at just short of 40%. The women candidates least likely to win election were in the Green Party, where only 2 women were elected from the 11 female candidates presented to the voter.
Table 5: Councillors elected in 2019 Local Elections (Number, %)
| COUNCILS | Male | Female | Total | %Female |
| Antrim, Newt’nabbey | 28 | 12 | 40 | 30.0 |
| Ards, North Down | 31 | 9 | 40 | 22.5 |
| Armagh City, Banbridge, Craigavon | 33 | 8 | 41 | 19.5 |
| Belfast City | 42 | 18 | 60 | 30.0 |
| Causeway Coast, Glens | 24 | 16 | 40 | 40.0 |
| L’Derry, Strabane | 27 | 13 | 40 | 32.5 |
| Fermanagh, Omagh | 30 | 10 | 40 | 25.0 |
| Lisburn, Castlereagh | 34 | 6 | 40 | 15.0 |
| Mid, East Antrim | 30 | 10 | 40 | 25.0 |
| Mid Ulster | 30 | 10 | 40 | 25.0 |
| Newry, Mourne, Down | 31 | 10 | 41 | 24.4 |
| TOTAL | 340 | 122 | 462 | 26.4 |
The Causeway Coast and Glens Council recorded the highest proportion of women councillors, at 40%. Numerically, Belfast City Council returned the most women, 18 but as this is a 60-seat council, their proportional share of seats is 30%, lower than that of the Causeway council. The Lisburn and Castlereagh Council elected the fewest women, 6 in all (15%). This council is heavily dominated by unionist parties in which lower proportions of women candidates contested the election, as Table 1 shows.
Each council is composed of 7 District Electoral Areas (DEA), with the exception of Belfast which has 10 DEAs. These DEAs return between 5 and 7 councillors, depending on population size. In all, there are 80 DEAs in Northern Ireland, of which 14 (17.5%) returned all-male delegations to their respective councils. There were no women candidates available to the voters in 4 of these DEAs: Macedon (Antrim, Newtownabbey council); Downshire West (Lisburn and Castlereagh council); Bannside (Mid and East Antrim council) and Larne Lough (Mid and East Antrim). That leaves 10 other DEAs in which women were on the ballot paper but failed to secure election: Bangor East and Donaghadee (Ards and North Down; Lisnasharragh (Belfast City); Enniskillen (Fermanagh and Omagh); Erne East (Fermanagh and Omagh); Downshire East (Lisburn and Castlereagh); Lisburn North (Lisburn and Castlereagh); Killultagh (Lisburn and Castlereagh); Knockagh (Mid and East Antrim) and Rowallane (Newry, Mourne and Down).
The small increase in women’s representation since 2014 (from 25.1% to 26.4%) hides considerable variation across the councils, as Figure 2 shows. The largest increase occurred in the Causeway Coast and Glens council (from 27% to 40%) followed by Antrim and Newtownabbey council (from 20% to 30%). The trajectory was not solely in an upwards direction. Fewer women were returned in four councils in 2019 than in 2014: Lisburn and Castlreagh (from 22.5% to 15%); Armagh City, Banbridge and Craigavon (from 26.8% to 19.5%); Belfast City (from 33.3% to 30%) and Mid and East Antrim (from 27.5% to 25%). This pattern serves as a reminder of the challenge faced by women in finding, and securing, a place in local politics in Northern Ireland.
Figure 2: Female councillors 2014 and 2019, by council (%)
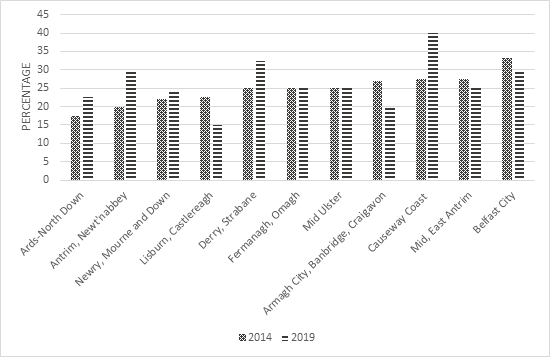
Figure 3 shows the share of local council seats held by women and men in the six local elections since 1997. It illustrates a very slow increase in women’s representation. At this modest rate, it will take another 12 elections, or until 2079, before women achieve half of all council seats. To put the challenge in more stark terms: a baby girl born today will be 60 years old before she sees women holding seats on a par with men in her local assembly.
Figure 3: Male and female seat share in Northern Ireland’s local councils 1997-2019 (%)

This analysis shows that considerable progress is required at local level in Northern Ireland if women are to hold the same share of seats as men. Local politics remains heavily patriarchal in culture and practice, and is particularly so among unionist parties. Given that the embedding of peace is heavily dependant on local communities working together to overcome the legacy of sectarianism, local councils have a vital role to play in fostering reconciliation. Excluding women from sharing equally in this responsibility goes against the grain of accountable democratic local decision-making.
- http://www.niassembly.gov.uk/globalassets/Documents/RaISe/Publications/2014/assembly_exec_review/4814.pdf and author’s calculations for 2019 ↑
- England: https://www.fawcettsociety.org.uk/news/womens-representation-in-local-government-stuck-in-the-past
Europe: http://www.europarl.europa.eu/RegData/etudes/BRIE/2019/635548/EPRS_BRI(2019)635548_EN.pdf ↑
Photo by Magda Ehlers is licensed under CC0
Professor Yvonne Galligan is Director of Equality, Diversity and Inclusion at Technological University Dublin. She was formerly at Queen’s University Belfast where she was Director of Gender initiative and Head of the School of History, Anthropology, Philosophy and Politics.
Discover more from Slugger O'Toole
Subscribe to get the latest posts sent to your email.