
 A bunch of hacks (programmers) and hackers (journalists – real and citizen!) attended ScraperWiki‘s workshop in the University of Ulster Belfast campus on Saturday.
The idea was to unearth benefit and stories from the public data, if necessary using robotic data scraping techniques to lift facts and figures out of ill-formatted webpages into a more useful database format to explore the connections.
Three teams formed, looking at NI Court decisions, comparing pay levels across public, private and voluntary vacancies advertised on Jobfinder, and looking at NI electoral turnout and how this maps onto other social statistics.
Ivor Whitten’s written up a comprehensive post over on Hand of History. Our team’s hacker Rob Moore worked with Ivor, Matt Johnston and myself to scrape some sample data out of Ark and then reprocess it. If we’re honest, it’s been a while since any of us programmed in Python (or PHP) … but we’ll achieve more next time!

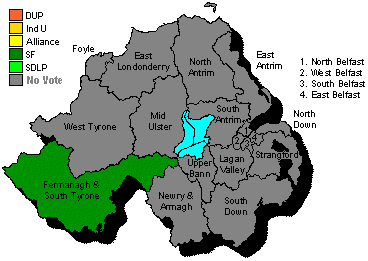
Given the levels of turnout at the May 2010 Westminster election, in 17 out of the 18 local constituencies the number of people not voting beat was greater than the winning candidate. Here’s what the map would look like if all those people had been forced to vote, but had chosen “None of the above” on the ballot paper.
To repeat, not only does no candidate achieve a 50% mandate of the potential electorate (and few even achieve a 50% majority of those who did vote), but in nearly all constituencies the votes for the winning politician are outnumbered by the number of people who couldn’t be bothered to cast any vote.
I’d assumed that Gerry Adams’ large majority in West Belfast would be the constituency where he beat the stay at home voters. But no. It was in the split seat of Fermanagh and South Tyrone where both the main unionist and nationalist candidates just outpolled the no shows.
As Ivor asked:
… was the only motivator to get bigger numbers out to vote sectarianism? Looked like it as a riled divided community seemed determined not to let the other side in.
It’s not rocket science, and it’s not novel, but it’s still a stark statistic.
With a bit of work to extend the proof of concept – using some of the raw data from EONI too – we should be able to turn around interesting stats within hours of the May 2011 election results. And the data will be available to everyone else through ScraperWiki.
Map adapted (greyified!) from Conal Kelly’s maps over on the Ark election site.

Alan Meban. Tweets as @alaninbelfast. Blogs about cinema and theatre over at Alan in Belfast. A freelancer who writes about, reports from, live-tweets and live-streams civic, academic and political events and conferences. He delivers social media training/coaching; produces podcasts and radio programmes; is a FactCheckNI director; a member of Ofcom’s Advisory Committee for Northern Ireland; and a member of the Corrymeela Community.
Discover more from Slugger O'Toole
Subscribe to get the latest posts sent to your email.


