A lot of spoiled votes, in some places much more than usual

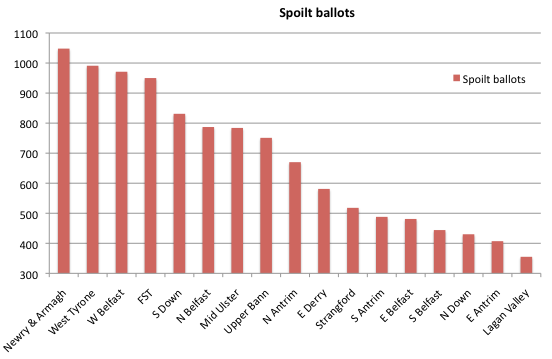
As there aren’t a lot of actual figures out there, I’ve compared the EONI polled vote figures with the BBC valid votes to try and work out the invalid votes per constituency. (The BBC numbers may not be entirely accurate so this should be taken with a health warning – for example I’ve had to exclude Foyle as it was giving a totally improbable 0.05%). On face value this election seems to have resulted in considerably more spoilt votes than …